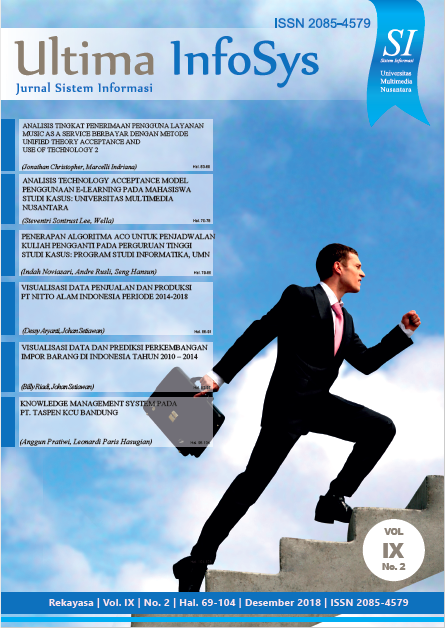
Data Visualization and Prediction of Goods Import Growth in Indonesia in 2010 - 2014
DOI:
https://doi.org/10.31937/si.v9i2.998Abstract
Import is one of the trade process conducted between two countries, the import process is done by a country to meet the needs of the country that is not meet by the ability of the country. Indonesia also imports many items such as fuel or rice. Therefore, to reduce the level of imports, we need to know which sector has the most import rate and whether the level of imports in that sector is increasing or not, so Indonesia can save the country's foreign exchange reserves.
Import data Indonesia displayed in the form of visualization of data created using the method of Visual Data Mining (VDM) and using Power BI as a tools. Indonesian Import Prediction is done to know the growth of Indonesia import rate by using Linear Regression method and using SPSS tools.
In a study of the growth of import levels in Indonesia, Indonesia has an import rate that increased between 8-20%, but in some periods experienced an increase and decrease caused by other factors such as consumption expenditure, currency exchange rates and state revenues.
Downloads
Downloads
Published
How to Cite
Issue
Section
License
Authors retain copyright and grant the journal right of first publication with the work simultaneously licensed under a Creative Commons Attribution-ShareAlike International License (CC-BY-SA 4.0) that allows others to share the work with an acknowledgement of the work's authorship and initial publication in this journal.
Authors are able to enter into separate, additional contractual arrangements for the non-exclusive distribution of the journal's published version of the work (e.g., post it to an institutional repository or publish it in a book), with an acknowledgement of its initial publication in this journal.
Copyright without Restrictions
The journal allows the author(s) to hold the copyright without restrictions and will retain publishing rights without restrictions.
The submitted papers are assumed to contain no proprietary material unprotected by patent or patent application; responsibility for technical content and for protection of proprietary material rests solely with the author(s) and their organizations and is not the responsibility of the ULTIMA InfoSys or its Editorial Staff. The main (first/corresponding) author is responsible for ensuring that the article has been seen and approved by all the other authors. It is the responsibility of the author to obtain all necessary copyright release permissions for the use of any copyrighted materials in the manuscript prior to the submission.


